Transportation
Start of page content
Columbia is the best place for everyone to live, work, learn and play. That means that Columbians are always on the move! The city’s transportation activities account for over 25% of the total greenhouse gas (GHG) emissions; with the biggest contributor being personal vehicles.
Columbia's Climate Action and Adaptation Plan has two goals for transportation:
- Reduce vehicle miles traveled.
- Increase the fuel economy of vehicles.
Transportation
Be Part of the Solution!
Find out how it is to get around without a car! Biking and walking are great forms of exercise and also help reduce our emissions.
Transportation & Climate Change
Federal grant for EV charging stations
Columbia receives federal grant for EV charging stations - The City of Columbia has received a grant to build electric vehicle chargers at two parking garages, the public library and the regional airport. The $3.6 million federal grant will fund the construction of 44 electric vehicle charging stations in Columbia.
Transportation & Climate Change
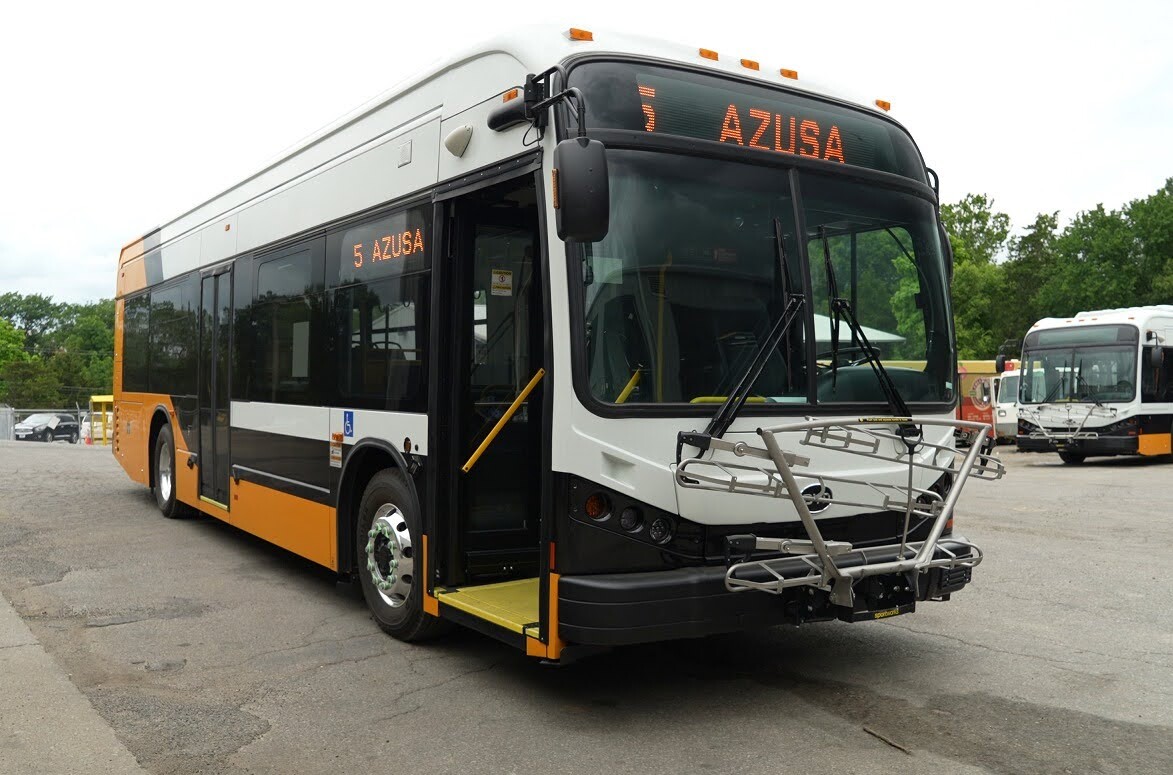
Six more electric buses
The City of Columbia’s commitment to sustainability is stronger than ever! Go COMO is pleased to announce the arrival of six brand new, all-electric buses manufactured by BYD, made in the USA. The new 35-foot buses have batteries that can be fully charged in just three hours and offer 30% more range. The latest models also provide increased seating capacity when compared to the City’s existing electric buses. They are a massive step towards reducing greenhouse gas emissions and provide a quiet and smooth ride that our riders prefer.
Join us in celebrating a greener, cleaner Columbia as we continue our journey toward a sustainable future. Our new electric buses are part of a climate action plan designed to reduce pollution and improve our air quality for future generations.
Follow GoCOMO updates @ facebook.com/GoCOMOTransit
CoMo Bike Co-op offers free bicycle repair and refurbished, low-cost bicycles
Located at the Armory Sports and Recreation Center.
To support the community’s transportation needs, the CoMo Bike Co-op offers free bicycle repair and refurbished, low-cost bicycles for a suggested donation. Our target demographic is underserved adults with transportation needs for work, school, and basic activities of daily living.
The free repair program is the primary function of the Co-op. Ancillary programs include repurposing and rehabilitating bicycles donated to the Co-op. Repurposed bicycles (predominantly bike-shop quality) are then offered to the community for a suggested donation and/or distributed via partnering organizations. Co-op services assist community residents in eliminating economic barriers to owning a bicycle. Sustainable management practices support landfill diversion.
Transportation & Climate Change
Climate Impacts on the Transportation System
Climate change causes more intense weather events, affecting road conditions in Columbia. Floods block roadways and trails while extreme heat weakens pavement and requires more maintenance. Columbia residents who walk or bike are exposed to extreme heat and poor air quality. Actions in the CAAP seek to increase vegetated areas near pedestrian and bike routes as well as improve shading at transit stops, improve health and safety outcomes, and promote the use of low-emissions transportation options.
How We Get Around Columbia
Biking & Walking
How we get around in our community influences the environment and our health. The City of Columbia currently has over 141 miles of painted bike lanes and 62 trail system miles.
Most trips in town are less than two miles, which making them accessible for cycling. Travelling at an easy pace, you can arrive to most local destinations in about 10 minutes, with no parking hassles. By cycling more and driving less you can reduce greenhouse gas emissions and air and water pollution, create safer streets for kids, support a quieter neighborhood, lessen the need for expensive road repair, and create a friendlier environment to live in. Start with a bike!